Introducing BCI: Credit Benchmark's Bank Consensus Indicator Signals Where Lenders See Risk
10 years of contributor insight reveal default rate shifts for Private Unrated US high-yield companies
Banks, financial institutions, and investors struggle with limited credit risk visibility for private, unrated, loan-financed borrowers. Unlike public bond issuers, these firms operate outside rating agency coverage and lack market price transparency. They need trustworthy, timely, and distinctive inputs based on actual lending decisions for early-warning models and credit dashboards – and to make better capital allocation and support lending decisions.
Credit Benchmark’s new innovative flagship index – the Bank Consensus Indicator (BCI) – built on a decade of data collection, directly addresses this gap. BCI tracks net credit rating migrations among ~1,000 U.S. high-yield private unrated companies from our global network of contributor banks. The BCI introduces a simple and reliable monthly way to monitor the credit risk of private, unrated loan-financed borrowers that lie outside public bond markets and rating universes. By distilling thousands of lender actions into a single metric, it offers a forward-looking lens into a usually opaque market.
This BCI provides a distinctive, lender-focused credit risk signal that differs from the current spread-based view in several ways
- Definition: The BCI is built from ~1,000 U.S. high-yield (BB+ or lower) entities using bank ratings, not investor-driven spreads.
- Forward looking: the BCI is correlated with annual changes in the % in the c-category, which is the source of most defaults.
- Correlated with annual S&P default rates: monthly BCI changes show likely default rate outcome
- Behavior: We compare BCI movements with market spreads and explain their divergence outside crisis periods.
- Validation: Aligns with external research (e.g. Moody’s EDF-X) on structural risk gaps between bond issuers and smaller, privately financed firms.
We will publish the BCI at the start of every month. Monitoring it alongside traditional market measures will give investors, lenders, and regulators a fuller, earlier view of emerging credit stress among U.S. high-yield corporates. (Other market segments also available.)
What is BCI?
The Bank Consensus Indicator (BCI) is Credit Benchmark’s monthly snapshot of lender sentiment toward U.S. high-yield private companies. Expressed as a percentage of the index universe, it answers a single question: are downgrades outweighing upgrades, or vice versa? A positive BCI % signals net downgrades (rising risk); a negative BCI % signals net upgrades (improving quality).
- Universe: ≈ 1,000 privately held U.S. companies with BB+ or lower Credit Consensus Ratings (CCR).
- Source data: Internal credit views from a global network of contributor banks aggregated into a single CCR per company.
- Monthly calculation: Net downgrades minus upgrades, as a percent of the universe.
- Granularity: 10-category detailed ratings
Because it is based on actual rating actions – not traded prices – the BCI captures credit dynamics among borrowers that rarely appear in public-market indices, making it a valuable complement to spread- and equity-based signals.
Understanding the BCI Universe
To better understand the underlying data and universe of the Bank Consensus Indicator, it’s important to examine the industry composition of the companies included in the BCI. The index covers approximately 1,000 privately held U.S. companies across various sectors, providing a comprehensive view of credit risk across the high-yield private corporate landscape.
The data comes from Credit Consensus Ratings (CCR), which aggregates internal credit views from a global panel of contributor banks. These banks provide their internal credit assessments, which are then aggregated into a single consensus rating per company. This approach ensures that the BCI reflects actual lender sentiment rather than market-based indicators.
The BCI universe is constructed using the following four key filters:
- United States: Companies with primary operations in the United States.
- Private: Neither the company nor its parent are publicly held companies.
- Unrated by Rating Agencies: Companies are not rated by major credit rating agencies.
- High Yield: Companies have BB+ or lower Credit Consensus Ratings (CCR).
Industry Composition
Underlying entities in the Bank Consensus Indicator (BCI)
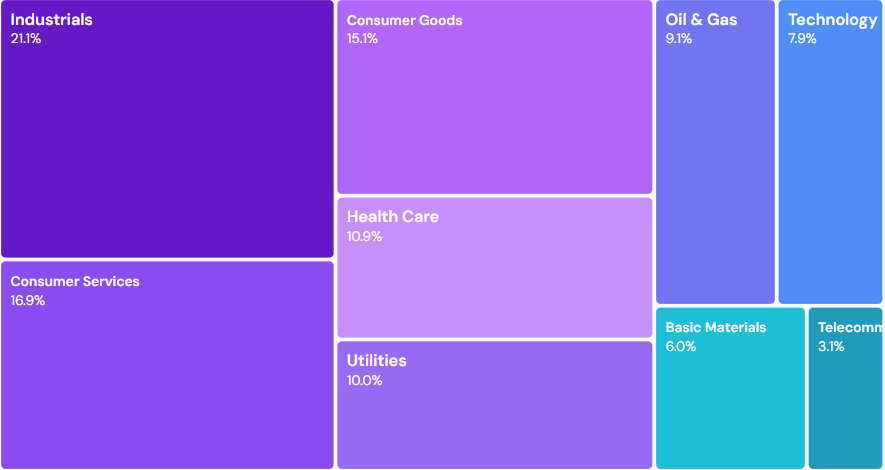
The chart above shows the industry breakdown of the BCI universe, revealing the diverse sector representation that makes the index a robust measure of broader credit conditions. This composition helps explain why the BCI can capture credit dynamics that may not be reflected in public market indices focused on bond issuers.
Evaluating the BCI over Time
How to interpret the BCI?
This chart shows the Bank Consensus Indicator (BCI). It’s a measure of corporate credit health.
Red bars above the line mean more companies are being downgraded, signaling rising risk. Green bars below the line mean more are being upgraded, signaling improving conditions.
Pre-COVID: A Stable Period
From 2017 to early 2020, the Bank Consensus Indicator (BCI) for US high-yield companies fluctuated near zero. This indicated a balanced credit environment where rating downgrades and upgrades were roughly equal, reflecting a period of broader economic stability – consistent with widely held views.
The COVID-19 Shock
The arrival of the pandemic in March 2020 triggered a dramatic spike in the BCI. The sharp move into positive territory represented a wave of credit rating downgrades as companies faced unprecedented operational and financial stress, signaling a rapid increase in perceived default risk across the market.
The Recovery
Beginning in early 2021, the BCI turned negative, indicating that for the first time since the pandemic began, credit upgrades were outpacing downgrades. This period marked a significant recovery phase, fueled by economic reopening and supportive fiscal and monetary policies that improved corporate credit quality.
2022-24: Rising Risk Signals
From mid-2022 through 2024, the BCI returned positive. This shift suggested that credit quality concerns were re-emerging, even as other economic indicators pointed to stability. This period of divergence between bank risk assessments and market indicators highlighted underlying pressures in the high-yield corporate sector.
2025: Are Banks Seeing Through the Noise?
From mid-2022 through 2024, the BCI returned positive. This shift suggested that credit quality concerns were re-Despite heightened economic uncertainty and turbulent headlines in 2025, bank rating actions have shown remarkable stability. The BCI has maintained a steady pattern, suggesting that banks are not adjusting their credit assessments in response to market volatility. This stability in bank ratings provides a contrasting view to headline risks, indicating that fundamental credit quality remains resilient in the face of broader economic concerns. emerging, even as other economic indicators pointed to stability. This period of divergence between bank risk assessments and market indicators highlighted underlying pressures in the high-yield corporate sector.
BCI correlated with S&P Default Rates
Comparing the 12-month average BCI against the annual S&P default rate reveals a strong positive correlation, suggesting the BCI is a robust leading indicator for defaults.
As a preliminary test to understand the usefulness of the BCI, we measured the annual BCIs against the published S&P observed Default Rates. The time series chart on the left illustrates how the S&P default rate (in purple) often follows the movements in the monthly BCI. The scatter plot on the right makes this relationship even clearer, showing a strong positive correlation between the two metrics with an R² = 0.88. This suggests that the BCI is not only a concurrent indicator but a powerful predictor of broader corporate defaults.
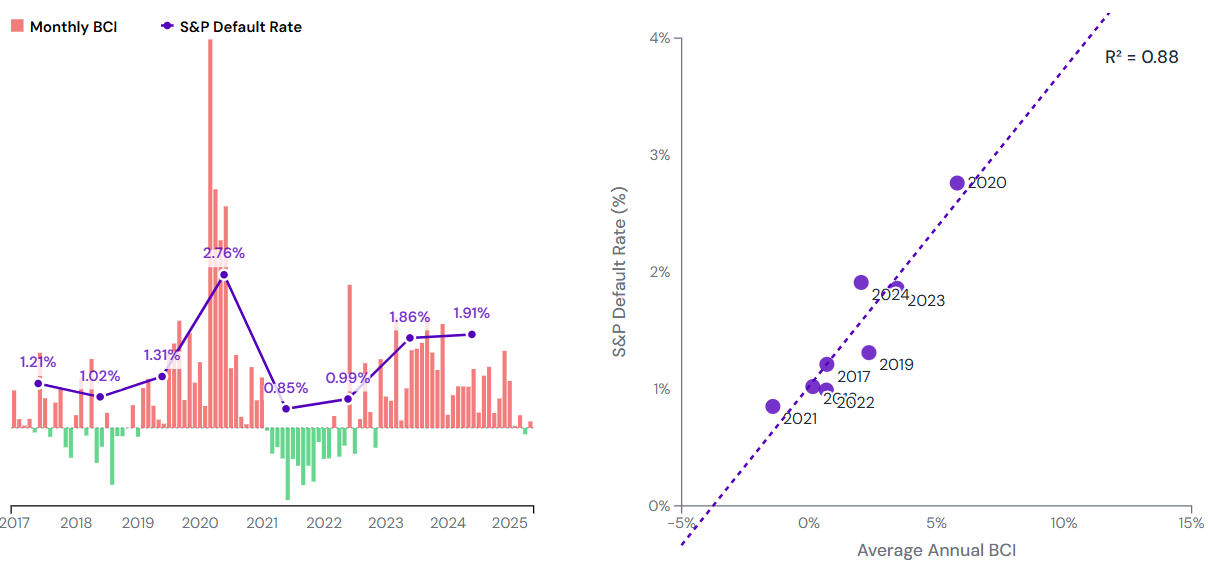
Key Findings:
- We calculate the average BCI for each calendar year to match S&P’s annual default rate reporting
- S&P publishes default rates with a 1-year lag (2024 default rates published in 2025)
- Our BCI data is available monthly, providing more frequent updates than annual default statistics
- The strong correlation (R² = 0.88) suggests the BCI is a reliable leading indicator for corporate defaults:
- Based on current BCI trends and historical correlation, 2025 appears on track for a lower observed, S&P Default Rate than 2024
BCI v. ICE BofA US High Yield Index Option-Adjusted Spread
Testing whether the BCI contains unique information about credit risk.
One widely followed credit indicator is the ICE BofA US High Yield Index Option-Adjusted Spread (BAMLH0A0HYM2) – the yield difference between high-yield corporate bonds and Treasury securities. This spread serves as a key measure of credit risk perception in the high-yield corporate bond market. High spreads indicate the market is pricing in more credit stress, higher risk of defaults, and tighter funding conditions for lower-rated borrowers. Leading insight into this movement can be powerful.
Constituents are U.S-dollar, fixed-rate corporate bonds rated below investment-grade (BB+ or lower) from highly-leveraged issuers across sectors -including auto finance, telecom/cable, energy exploration, and retail – so long as each bond has at least $100 million of notional outstanding and more than one year to maturity.
BCI v. US High Yield Spread
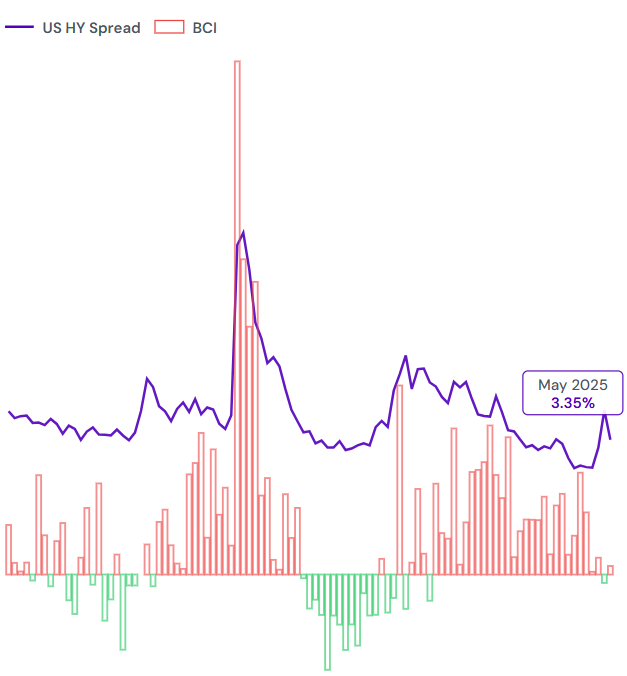
Visual Correlation
When plotting the BCI alongside the US High Yield Spread, they visually appear to correlate together. Both indicators tend to move in similar directions during periods of economic stress and recovery, suggesting they may be capturing related aspects of credit market sentiment.
The COVID Distortion
To examine the relationship more directly, we can use a scatter plot. This view plots each month as a single point, with the BCI on the x-axis and the High Yield Spread on the y-axis. This helps reveal the underlying correlation, free from the distortions of a dual-axis time series.
The relationship appears to be heavily influenced by a handful of data points from the COVID-19 shock.
These outliers are now highlighted in red, while all non-COVID data points are highlighted in purple.
A Weaker Relationship
If we were to re-estimate the best fit line after excluding the COVID-era outliers, the best-fit line flattens significantly.
The R-squared drops from 0.43 to 0.07, confirming the pandemic data points inflated the correlation.
During the pre and post-pandemic periods, there appears to be little to no relationship between the BCI and the US High Yield Spread.
Divergence between BCI and HY Bond Markets
We initially wondered whether the BCI provided a unique credit lens, not captured by market indices. The weak correlation with the US High Yield Spread outside of crisis periods suggests there may be information in the BCI; credit dynamics that market-based indicators may not reflect.
Consider the most recent period—the extended stretch of positive BCIs since mid-2022.
Why are banks consistently net downgraders of US HY companies while US High Yield spreads have been relatively stable or even improving?
One explanation is a divergence between the credit risk of companies with access to the HY bond market and those who do not: a split between the “haves” and the “have-nots”.
Moody's EDF-X: A Corroborating View
External validation from Moody’s research.
Our analysis revealed a surprising disconnect between HY bond issuers and HY loan-financed companies. But we weren’t alone in this observation. Moody’s has observed similar patterns using their EDF-X platform, which tracks expected default frequencies across a broader universe of companies:
While their universe is different than the BCI—they track 5,500 public companies versus the BCI’s focus on high-yield US private corporates (BB+ or worse CCR)—the takeaway is consistent:
Moody's EDF-X: A Corroborating View

The historically large 5.9 percentage-point gap in the average expected risk of default between all listed US companies (9.2%) and high-yield companies (3.3%) is a reflection of how company size, sensitivity to interest rates, and access to capital have affected credit risk.
High-yield companies financed predominantly by bonds — although often highly levered and with sub-investment grade ratings — have been relatively less affected by higher interest rates. The median sized high-yield bond issuer is 12 times larger (in terms of assets) than the median US public company, and has access to larger, liquid pools of capital compared to medium-sized, loan-financed companies. Importantly, many bond issuers proactively refinanced their liabilities at lower, fixed rates after the pandemic.
Relatively smaller, loan-financed companies are somewhat more capital constrained, and pay floating rates on their debt.
Conclusion — Getting the BCI in Your Workflow
In this paper, we’ve introduced the Bank Consensus Indicator (BCI) and demonstrated its value as a unique lens on credit risk. We showed the industry composition of the BCI, covering approximately 1,000 privately held U.S. companies across diverse sectors, providing comprehensive coverage of the high-yield private corporate landscape.
We examined the BCI’s movement through time, revealing how it captured major economic shifts from pre-COVID stability to pandemic stress and subsequent recovery. The BCI shows a strong positive correlation with S&P default rates, suggesting it’s a reliable leading indicator for broader corporate defaults.
Outside of crisis periods, the BCI shows little correlation with public high-yield bond spreads, indicating it captures credit dynamics not reflected in market-based indicators. Moody’s EDF-X research corroborates our findings, showing similar patterns of divergence between bond issuers and smaller, loan-financed companies.
These insights demonstrate that the BCI provides unique information about credit risk among private, unrated companies—a segment that traditional market indicators often miss.
Getting the BCI in Your Workflow
Interactive Dashboard
The BPS chart and underlying time-series are refreshed at the start of each month on Credit Benchmark Analytics. Log in at analytics.creditbenchmark.com and select “BPS – U.S. HY Private Corporates” from the Indices menu.
Dive deeper into the BPS data with our interactive dashboard:
Monthly Email Briefing
Join the “BPS Update” mailing list on the Credit Benchmark website (Resources → Insights) to have the latest chart pack and commentary delivered to your inbox on publication day. No spam, unsubscribe anytime.
Data Feed / API
If you prefer the series inside your own models or dashboards, request API or SFTP access via datafeeds@creditbenchmark.com; a token and spec sheet are provided on approval and the BCI is available in CSV or JSON format alongside other Credit Benchmark indices.
Other segments of data are available by sector, geography, HY/IG category and public/private designation. Contact us at info@creditbenchmark.com to learn more.